hd_auto_umap() runs a UMAP analysis on the provided data and plots the UMAP results.
Usage
hd_auto_umap(
  dat,
  metadata = NULL,
  by_sample = TRUE,
  impute = TRUE,
  plot_x = "UMAP1",
  plot_y = "UMAP2",
  plot_color = NULL,
  plot_palette = NULL
)
Arguments
- dat
An HDAnalyzeR object or a dataset in wide format and sample ID as its first column.
- metadata
A dataset containing the metadata information with the sample ID as the first column. If a HDAnalyzeR object is provided, this parameter is not needed.
- by_sample
If TRUE, points represent samples. If FALSE, points represent features. Default is TRUE.
- impute
If TRUE, missing values will be imputed using the k-nearest neighbors algorithm (k = 5). Default is TRUE. description
- plot_x
The name of the column in
dim_resthat contains the x-axis values. Default is "PC1".- plot_y
The name of the column in
dim_resthat contains the y-axis values. Default is "PC2".- plot_color
The name of the column in
dim_resthat contains the variable to be used to plot the points color. Default is NULL.- plot_palette
The color palette for the plot. If it is a character, it should be one of the palettes from
hd_palettes(). Default is NULL.
Examples
# Create the HDAnalyzeR object providing the data and metadata
hd_object <- hd_initialize(example_data, example_metadata)
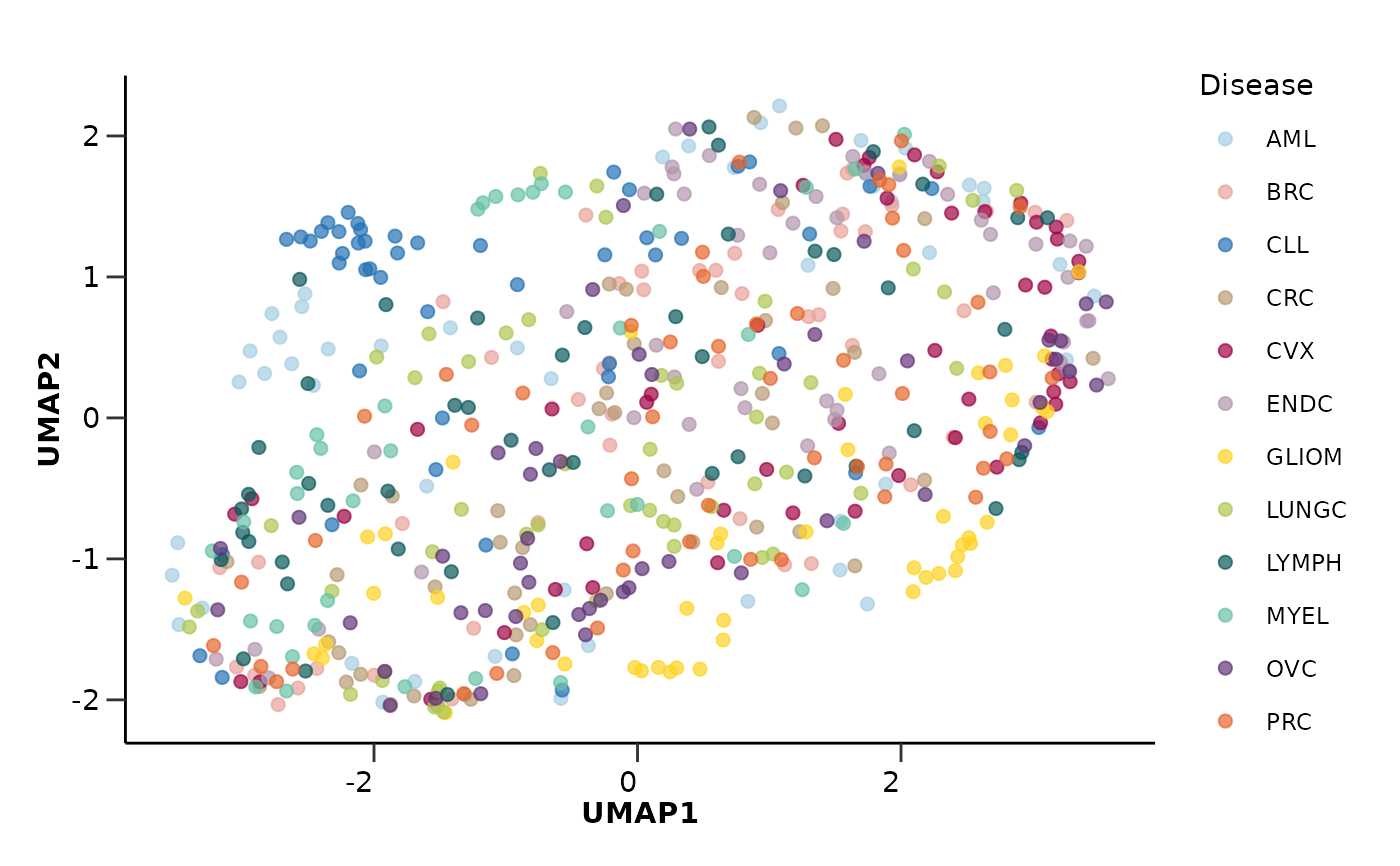
# Run the UMAP analysis
hd_auto_umap(hd_object, plot_color = "Disease", plot_palette = "cancers12")
#> $umap_res
#> # A tibble: 586 × 3
#> DAid UMAP1 UMAP2
#> <chr> <dbl> <dbl>
#> 1 DA00001 -2.62 0.384
#> 2 DA00002 1.99 1.73
#> 3 DA00003 -1.69 -1.87
#> 4 DA00004 -2.17 -1.74
#> 5 DA00005 -2.83 0.315
#> 6 DA00006 1.54 -0.733
#> 7 DA00007 -3.49 -0.886
#> 8 DA00008 1.54 -1.08
#> 9 DA00009 -0.655 0.278
#> 10 DA00010 1.93 1.53
#> # ℹ 576 more rows
#>
#> $by_sample
#> [1] TRUE
#>
#> $umap_plot
#> Ignoring unknown labels:
#> • Color : "Disease"
 #>
#> attr(,"class")
#> [1] "hd_umap"
#>
#> attr(,"class")
#> [1] "hd_umap"